Basepair’s whole genome/exome analysis pipelines take minutes to set up, and hours (or less) to run. Reports are auto-generated, and include publication-ready figures, interactive plots, and robust variant and gene browsers.
For a more detailed introduction to Whole Genome Sequencing Analysis why not check out the the Analysis Tutorial.
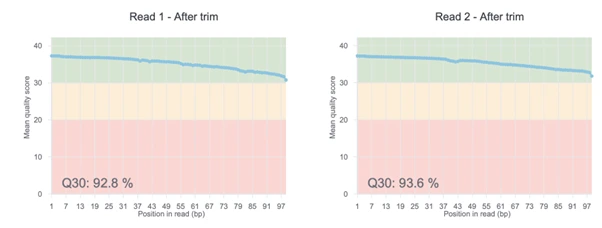
The quality of your DNA sequence analysis depends on the quality of your input. With each DNA-Seq report, Basepair provides useful QC plots that assign quality ratings to your data. You’ll quickly be able to spot any contamination and have an overview of base distribution.
If an interesting relationship or trend in the data is observed in one of the visualizations in our interactive reports, then maybe that’s the time to collaborate with a bioinformatician on an informed question.
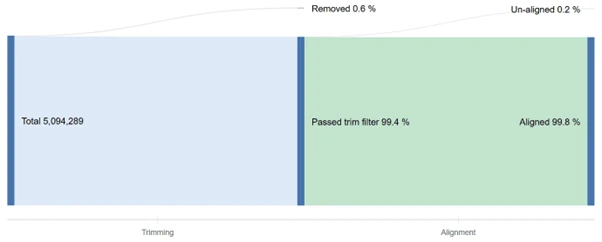
What portions of your DNA-Seq data was trimmed? Which reads were usable? The read count graph provides fast answers for any of your data quality questions.
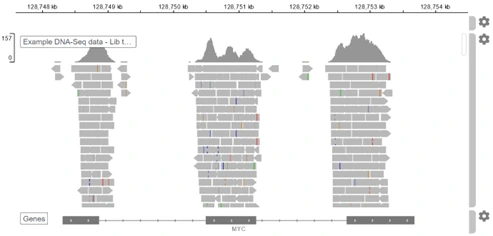
We made visualizing genome coverage for various types of NGS data simple, interactive, and intuitive. All the technical tasks happen under the hood. Now you can explore all your raw DNA-Seq data, without the need for file conversions or downloading additional software.
Have a .vcf file and not sure what to do with it? The Variant Browser for whole genome/exome sequence data is a full-featured variant explorer with a collection of flexible parameters and filtering options, allowing anyone to quickly look through .vcf data and find what they need.
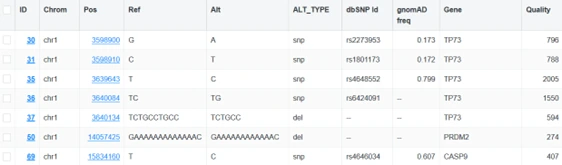
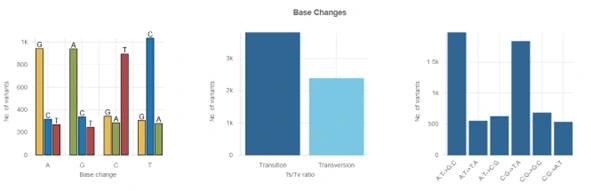
In addition to the powerful Variant Browser, all variant workflows include a number of helpful metrics, such as gene annotations, base change counts, number of variant types, and much more.
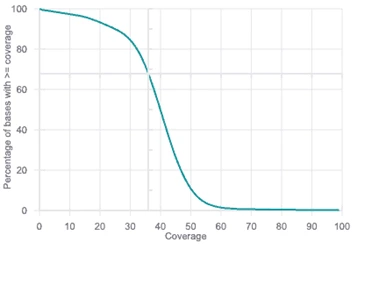
Basepair includes a coverage plot for your whole genome/exome data, pinpointing how well targeted regions are covered by data.
Try Basepair’s free 14-day trial, and try all of these features for yourself. Inspect finished reports, use sample data or upload your own. Contact any of our Sciencewerke representatives at [email protected] or call +65 6777 1045 today.