
ChIP-Seq Analysis
Automated ChIP-Seq Peak Calling, Alignment, and Pathway Analysis

Automated ChIP-Seq Peak Calling, Alignment, and Pathway Analysis
Get publication-ready results within hours - not days or weeks. Basepair’s automated ChIP-Seq data analysis enables alignment, read counts (complete with trimming and deduplication numbers), peak calling, pathway enrichment analysis, motif analysis, and interactive figures and plots to get you closer to publication.
ChIP-Seq refers to chromatin immunoprecipitation followed by next generation sequencing (NGS). This technique is used to find DNA-protein binding, such as transcription factor binding sites, histone modification, open chromatin regions, and more. The core idea behind each of these techniques is to cross-link and immunoprecipitate the epitope of interest and then sequence the pull-down DNA. For a more detailed introduction to ChiP-Seq, check out this Analysis Analysis Tutorial.
Their normal and disease model iPS cell lines were also generated using the same reprogramming method without proto-oncogenes MYC and Lin28 transcription factors, minimizing downstream oncogenic risks for therapeutic developers.
Able to scale from a single sample to thousands with the help of parallel processing. No coding required.
Choose from ready-to-use ChIP-Seq analysis pipelines, hit Run, and get publication- ready results in hours, not days or weeks.
Used by top universities and peer-reviewed publications – with dozens of published studies using our software.
ChIP-Seq pipelines include popular options such as alignment, QC, read counts, pathway and motif analysis, and peak calling, including a table of peaks and heatmaps.
Check the quality of your raw ChIP-Seq data with before- and after-trim QC charts. The QC score helps uncover any sequencing issues or contamination in your input data.
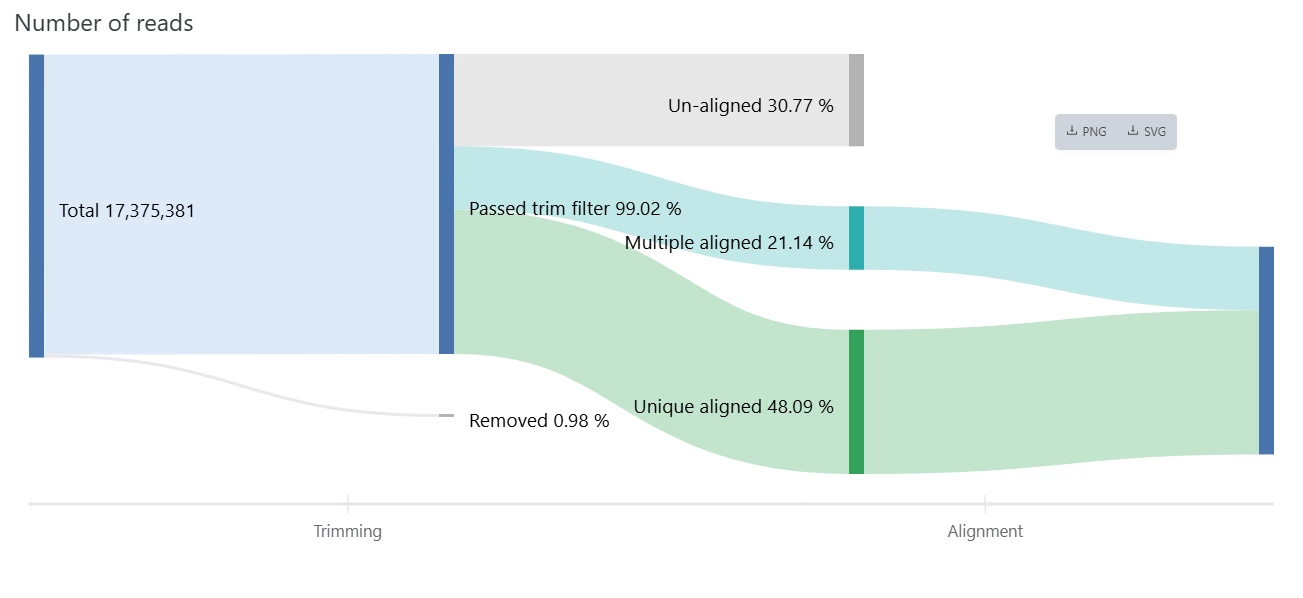
The read count flow provides a big-picture overview of usable reads at the end of the trimming, alignment, and deduplication processes. Think of it as a data analysis assembly line: input raw data, and get an output of usable reads.
The built-in Genome Browser allows for a birds-eye view of your raw genomic data. The platform handles any necessary conversions, presenting a visual overview of your ChIP-Seq data without additional file conversions or software.
Easily identify signal peaks in your data. Each peak is annotated as promoter, intronic, or intergenic, with the corresponding gene displayed. For any peaks found, motif analysis is performed to find overrepresented transcription factor binding sites.
The heatmap and composite profiles summarize your data around transcription start sites (TSSs) and annotated genes. This allows you to visually assess the overall quality of your ChIP-Seq data, including the enrichment of your target over background and its binding pattern relative to genes.
Ready to try out our pipelines? Try Basepair’s free 14-day trial, explore their sample reports or upload your own ChIP-Seq data. Choose from a number of popular pipelines, such as QC, alignment, peak calling, motif analysis, and more. Contact any of our Sciencewerke representatives at [email protected] or call +65 6777 1045 today.